REB is thrilled to release the Top 50 Sales Offices 2026, a ranking that spotlights Australia’s top-performing real estate sales teams.
Now in its 14th year, this prestigious ranking recognises the hard work and achievements of sales offices across Australia that made the most out of a booming property market in the 2024–25 financial year while demonstrating continued dedication to helping clients buy and sell their homes.
These top sales offices have gone above and beyond in their local markets and raised the national benchmark for excellence that other aspiring agents could emulate.
A WORD FROM OUR PARTNER
“Riverstone Partners proudly celebrates the outstanding performance of the Top 50 Sales Offices in Australia. Helping agencies create the capacity to lift sales is the core of our business. Congratulations to the winners and we look forward to helping more agencies simplify their sign-on to settlement process in 2026.
- Lucas McEntee, CEO, Riverstone Partners
Using a range of indicators to determine the results, the REB Top 50 Sales Offices 2026 ranking recognises the best real estate teams that have gone above and beyond for their clients and set the standard in the industry.
Sign up now to view the ranking.
Already registered? Enter e-mail to log-in
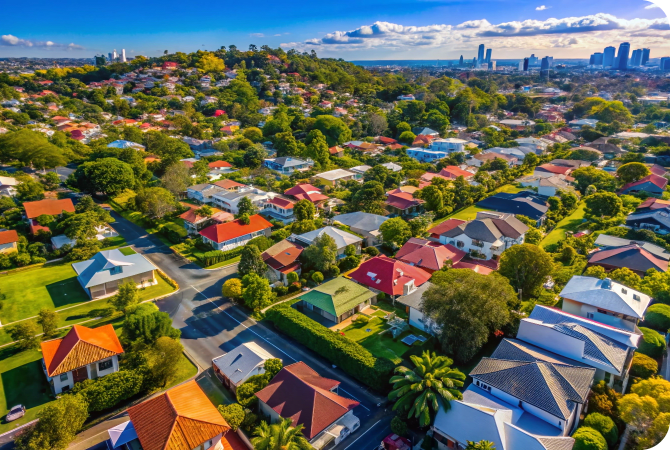
Sales offices across Australia were buoyed by a robust property market in 2025, with Cotality figures revealing that the Home Value Index surged by 8.6 per cent, adding around $71,400 to the national dwelling value.
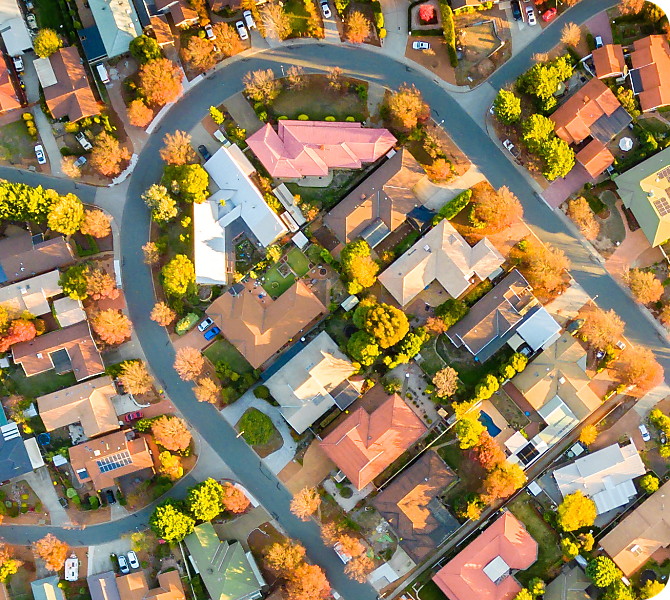
Moreover, since September 2025, the expanded Home Guarantee Scheme has fuelled a surge in lower-priced homes, which have generally recorded stronger growth than higher priced homes. Homes under the price cap grew by 3.6 per cent in the December 2025 quarter, while homes above the price cap grew by 2.4 per cent, according to Cotality.
The Top 50 Sales Offices 2026 ranking was determined by Agile Market Intelligence by using several key metrics from 1 July 2024 to 30 June 2025. These included total number of listings, total value of settlements, total number of settlements, average days on market, and number of staff as at the end of FY25. These metrics were evaluated and ranked across all submissions.
The settlement figures from the 2024–25 financial year mirror the healthy property market and showcase the talent and hard work of the leading sales teams. Indeed, amid growing buyer demand and rising property prices, the top 50 sales offices settled 582.0 sales in FY25, up from 554.0 in the previous financial year. Meanwhile, the top 10 sales offices also grew their settlement figures from 1,063.0 in FY24 to 1,129.0 in FY25.
The rise in average total number of settlements resulted in a corresponding spike in average total value of settlements across the leading sales offices in this year’s ranking.
The top 50 sales offices settled sales totalling an average of $702.2 million in FY25, a sharp uptick from $638.6 million in the previous year. Similarly, average total value of settlements rose to a whopping $1.3 billion across the top 10 sales offices from $1.1 billion in FY24.
Properties spent more time on the market, highlighting that buyers took their time to sign on the dotted line as they faced housing affordability challenges. Average days on market increased from 32.0 to 34.0 among the top 50 and from 27.4 to 28.7 days among the top 10 sales offices
33.9
AVERAGE DAYS ON MARKET - TOP 50
28.7
AVERAGE DAYS ON MARKET - TOP 10
The staff efficiency rating increased from 21.5 in FY24 to 23.9 in FY25 among the top 50 sales offices, and from 25.3 to 26.1 among the top 10 sales offices.
The efficiency rating is measured by calculating average settlements per number of sales-focused staff.
23.9
AVERAGE EFFICIENCY RATE - TOP 50
26.1
AVERAGE EFFICIENCY RATE - TOP 10
As property prices continued to trend upward across Australia, the average sales price for the leading sales offices also climbed in FY25. Across the top 50 sales offices, the average sales price stood at $1.3 million, up from $1.2 million in FY24. Similarly, the average sales price was $1.2 million for the top 10 sales offices – a healthy increase from $1.1 million in the previous year.
The average number of sales agents decreased in FY25 from 20.5 to 18.9 across the top 50 offices, and from 39.4 to 34.5 across the top 10 offices.
Support staff numbers also dipped across the top 50 sales offices from 13.2 to 11.4. However, this increased across the top 10 offices from 8.7 in the previous year to 14.0 in FY25.
2025
VS 2026
- Average number of settlements
- Average total value of settlements
- Average days on market
- Average settlements per number of sales-focused staff (efficiency rate)
- Average sales price
- Average number of sales agents
- Average number of support staff
Top 10 Sales Offices 2026
- 1-
- 2-
- 3-
- 4-
- 5-
- 6-
- 7-
- 8-
- 9-
- 10-
- - -
COMPANY INFO
Number of settlements:
--Efficiency rate:
--Total value of settlements:
--REB TOP 50 SALES OFFICES 2026
| Rank | Office | State | Sales support staff | Sales agents | Average days on market | Average sales price | Number of settlements | Total value of settlements | Efficiency rate |
|---|
Disclaimer: Real Estate Business has undertaken a process to ensure the accuracy of data used to formulate the REB Top 50 Sales Offices 2026 ranking. Data for the ranking was supplied by individual agents, offices and/or head offices. While Real Estate Business has made every attempt to validate the accuracy of the data, any errors or omissions are the ultimate responsibility of the company or individual that supplied the data and any associated information. To the full extent allowed by law, or the ranking participants, its publisher Momentum Media and Momentum Media employees excludes any liability for any loss or damage sustained by readers arising from the supply, use, or promotion of the REB Top 50 Sales Offices 2026 ranking.
Copyright: Content on this website, including material in downloadable files, is protected by copyright. Copyright of the content provided on this website is owned by Momentum Media Group Pty Ltd (“Momentum”). Where copyright is vested in any third party, including data and images , permissions have be granted to Momentum to reproduce such work. You must not reproduce or communicate any of the content on this website in any way whatsoever, including files downloadable from this website, without the permission of Momentum.