
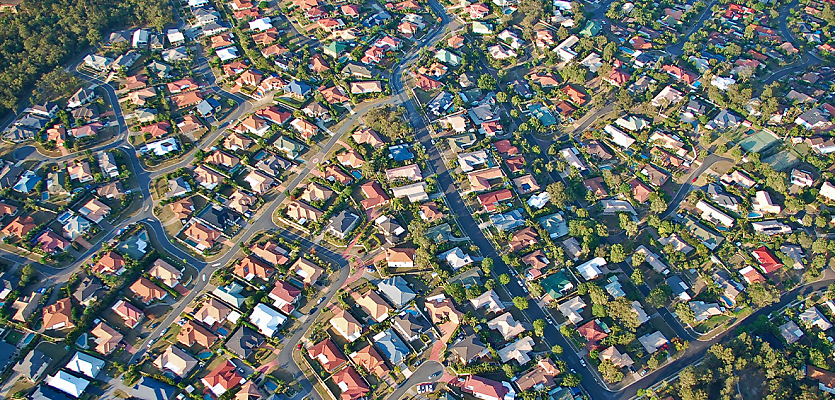
Despite profitability reaching a two-decade high nationally, some home owners have suffered losses around the country, with the outlook for 2026 remaining uncertain ahead of possible rate rises.
New findings from Cotality have shown which property markets have experienced the worst losses in the September quarter.
The Pain & Gain Report, which covered approximately 100,000 resales, showed that 95.5 per cent of sellers made a nominal profit, up from 94.9 per cent in the June quarter – the strongest result since July 2005.
According to Cotality’s head of research, Eliza Owen, increased profitability was largely correlated with rising market values throughout the year, fuelled by improved credit conditions following rate cuts.
While Brisbane, Adelaide, and Perth recorded some of the highest profitability, Darwin, Sydney, Melbourne and Hobart saw the highest rates of loss-making sales.
Where was the pain mostly felt?
Darwin saw the highest incidence of loss across the capital cities at 17.2 per cent, while the regional Northern Territory had the greatest overall incidence of loss at 26.5 per cent.
Despite recording the highest rate of losses, Darwin also saw the greatest improvement in profitability in the past 12 months, with the incidence of gains from resales increasing almost 14 percentage points to 82.8 per cent, up from 69.0.
Melbourne recorded the second-highest rate of loss across the capital city markets, with 9.3 per cent of negative gain resales in the September quarter.
However, data showed that the city’s rate of loss-making sales has declined for two consecutive quarters, down from 10.6 per cent in the June quarter of 2025 and 11.3 per cent in the March quarter.
“This coincided with a 3.8 per cent lift in home values across the city from the end of 2024 to the end of September 2025,” Cotality said.
Sydney followed with the next-highest rate of loss-making sales at 7.5 per cent, falling from 7.8 per cent in the previous quarter.
While there was a 20-basis point reduction in the rate of loss-making unit resales to 11.9 per cent, the rate of loss-making house resales remained steady at 1.5 per cent.
The Harbour City had the third-highest nominal gain from resale across the capitals for all dwellings, at $399,000, but continued to lead nominal gains for houses during the quarter at $675,000.
According to the report, Hobart saw the biggest jump in the rate of loss-making sales across the capitals during the quarter to 7.2 per cent, up from 5.6 per cent in the previous quarter.
Cotality said that the result marked the highest rate of loss across the city since the December quarter of 2016, and came despite city-wide values remaining reasonably steady in the June quarter.
“However, with Hobart home values still about 10 per cent below the high in March 2022, it is recent re-sales driving the loss,” it said.
Unit losses
The report found that units fell behind houses in profitability, with 97.9 per cent of house resales turning a profit, compared to 90.6 per cent for units.
It said that while units accounted for only a third of resale activity, they made up 68.9 per cent of all loss-making sales.
The losses were concentrated in key local government area (LGA) markets with a relatively high incidence of loss-making sales, particularly in the municipalities of Melbourne, Parramatta, Port Phillip, Sydney, and Stonnington.
“Together these unit markets accounted for 35.4 per cent of loss-making unit resales,” the report said.
Darwin and Melbourne had the lowest proportions of unit sellers who made a gain, at just 68.4 per cent and 80.5 per cent, respectively.
Across the country, 88.1 per cent of unit sellers in Sydney made a profit, while 87.6 per cent in Perth, and 99.9 per cent in Brisbane.
Regions versus capitals
The regions have outperformed the combined capitals for profitability since June 2020.
Data showed that 97.3 per cent of regional resales resulted in a nominal gain in the September quarter, compared to 94.4 per cent across the capitals.
“The rate of profitability rose faster in the regions than the capitals, up 70 basis points and 50 basis points respectively,” the report said.
Cotality said the higher regional profit rates in recent years were part of a pandemic-driven upswing that also drove increases in value.
What’s next for 2026?
The report said that in 2026, the outlook was less certain, as a resurgence in inflation had altered the trajectory for interest rates and made another cash rate more likely.
“Affordability already appeared to be thinning buyer demand at the higher-end of housing markets, with some higher-value segments of the Sydney housing market already moving into decline at the end of 2025,” it said.
Owen also said that weakening market conditions, such as the capital city clearance rate dipping below 60 per cent at the end of 2025, often coincided with a slowing in profitability.
“We are now seeing some higher-value segments in Sydney already moving into decline, which could test the resilience of profitability for short-term sellers in the year ahead,” she concluded.
Make Real Estate Business a preferred news source on Google.
