Managing your territory has moved to a whole new level as agents learn the value of engaging with mapping and geospatial services.
A wide range of geospatial and mapping tools currently exist in the market, and each year they get better. Indeed, with the huge investment in mapping from Google, Apple and others, I expect the next few years will see a revolution in how we use mapping tools.
A good early example of a very useful tool is Territory Builder in the RP Data RP Professional system. In this article we will use this application to create unique insights into a sub-market of a suburb that can be used to help buyers and sellers make a decision on the appropriate price.
The Brisbane floods in 2011 were devastating in many ways. One of the perceived effects in our industry was a drop in the volume of sales and the prices achieved.
Was this effect real? If so, as an agent how do you advise new vendors and buyers about buying or selling in the flooded areas? Also, how do you help them understand what they should expect to pay and when they should sell, after an event like the floods?
Is there a way to tell how much was directly related to the floods, ie. properties that did actually flood, and how much was the psychological/fear effect preventing non-flooded properties from transacting as buyers' lost confidence?
Examining the properties in the Brisbane suburb of Graceville that flooded, I drew a territory approximately tracing the floodline and analysed the properties inside this territory against properties outside this area. A chart of number of sales as a percentage of total shows the effect immediately:

The effect in 2011 was immediate – the flooded area had a drop from an average of 24 sales per year to just four sales. Sales in the non-flooded area also dropped, but not as much, from an average of 83 to 45 sales. Subsequent years saw numbers in the flooded area return to approximately normal.
Sales prices were initially a surprise as the drop in median price in the flooded area did not seem to be different to the equivalent drop in the non-flooded area. Note in the chart below, no median is calculated for the flooded area in 2011 due to the low number of sales.

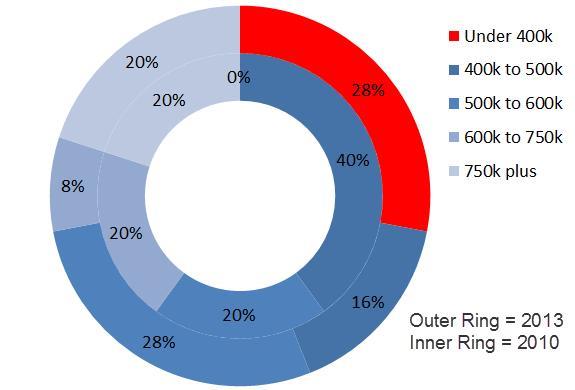
But a closer look does show an impact. The number of properties selling for less than $400,000 jumps after 2011. Twenty-eight per cent of properties sold for less than $400,000 in 2013, compared to none in 2010:

The conclusion I came to is that the floods had an immediate impact on sales volumes for properties in the flooded area. This impact lasted throughout 2011, but then returned to normal. Median sales prices recovered within a year to around what should be expected in Graceville. However, there appeared to be a set of properties selling for less than $400,000 that was not there in 2010.These are the properties that most likely were not just flooded on their land, but had significant damage too. Only these show a long-term drop in expected sales price.
One of the pillars of RP Data is to provide ‘confidence in decision-making’. As an agent using a territory manager you can now assist vendors and buyers to be confident in their decisions around property in Graceville and what to expect: a drop for properties significantly affected by the floods and normal prices for all the others including those in the flood area. Although sad for the owners of the relatively small number of severely flooded properties, this is good news for the rest as uncertainty can be removed from the decision.


You are not authorised to post comments.
Comments will undergo moderation before they get published.